What It's About
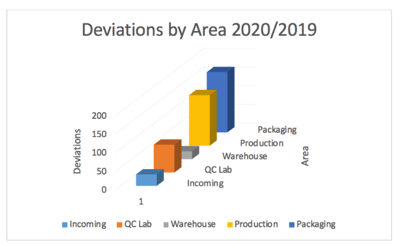
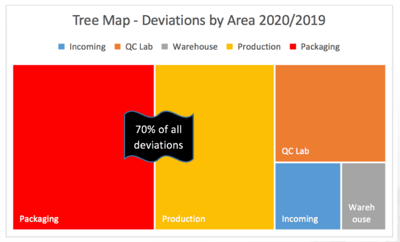
This white paper illustrates some of the common techniques for data visualization in biotechnology and pharmaceutical laboratory settings. It also provides examples of the types of data that can be conveyed with visualizations.
Who it’s for
Use the information when incorporating data visualization techniques into your reporting and workflows to bring additional insights to your organization. The visualizations will allow for multiple data sets to be presented in one image, adding value to your data.

How to use it
This white paper illustrates some of the common techniques for data visualization in biotechnology and pharmaceutical laboratory settings. It also provides examples of the types of data that can be conveyed with visualizations.

Frequently Asked Questions
Is this really free?
Absolutely! We're sharing this free knowledge that we hope you'll find useful. Keep us in mind next time you have LIMS questions.
Why do I need to share my information?
We ask for your personal information so we can provide you with important details about the white paper, including access links and any follow-up materials. Your information also helps us tailor future content to your needs. Rest assured, your privacy is important to us, and we will never share your information without your consent.
Who wrote this white paper?
Our white papers are always written in-house with the assistance of our expert consultants.
.png?width=850&height=124&name=cropped-CSolsLongLogo_rgb_taglinesecondary_tagline3-2-resize%20(1).png)
